I wrote a book!
Data visualization is the art and science of making information visible. On paper and in our imaginations, it’s a language of shapes and colors that hold our best ideas and most important questions. As we find ourselves swimming in data of all kinds, visualization can help us to understand, express, and explore the richness of the world around us. So I wrote a book about it!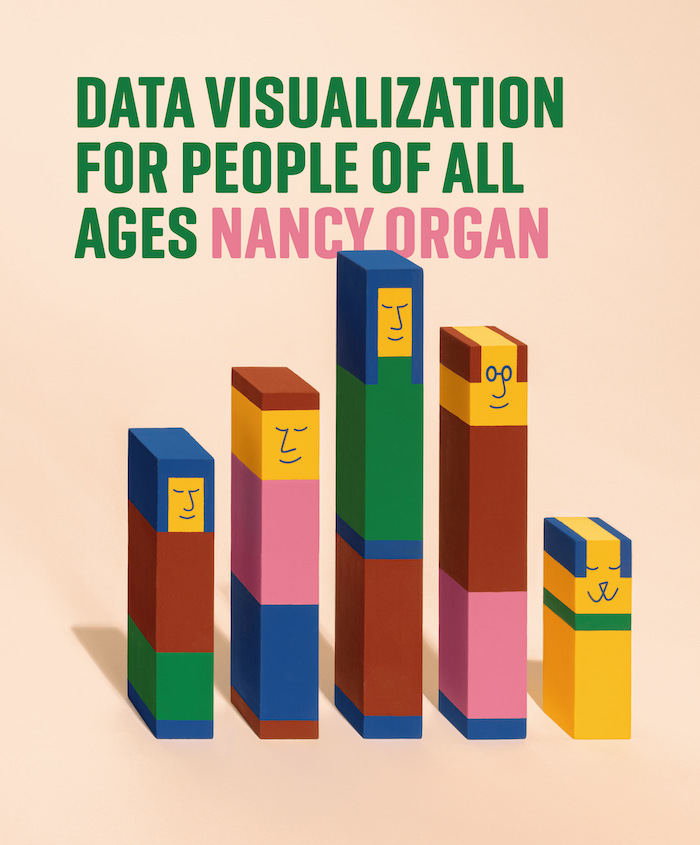
Data Visualization for People of All Ages invites everyone to the table to share the joy of one of today’s most necessary skills. Packed with practical examples and exercises to help you connect the dots, this book will teach you how to create and understand data visualizations on your own—all without writing a single line of code or getting tangled up in software. Perfect for home or classroom use, this friendly companion gives people of all ages everything they need to start visualizing with confidence.
Available now on...
Routledge
Amazon
Barnes & Noble
 I'm a data visualization designer and educator with experience in research, education, and tech. Currently, I work at the exciting healthcare tech startup, Trilliant Health. In past lives I was a Data Visualization Developer at Microsoft, an Information Visualization instructor to Masters' and undergraduate students at the University of Washington, and a medical researcher at UW and Vanderbilt University. My formal training is in Statistics from the University of California, Berkeley.